Water and Environmental Data Interpretation and Visualisation Solutions
Salt Balance Chart-maker
Our Salt Balance Chart-maker
Diagram for visualising water quality salt balance data
CBSS created a Salt Balance Chart-maker to plot macro cations and anions on an adapted Maucha diagram reflecting water quality characteristics in a scientifically correct visual salt balance.
To ensure appropriate interpretation of water quality data, a graphical multiparameter representation enable the visualisation of the results into a water quality type that summarises the hydrochemistry of the major cations and anions for a particular monitoring location. As different valences of cations and anions prevent the direct comparison of concentrations in mg/L with each other, a multiparameter graph always require the conversion of concentrations in mg/L to milli-equivalents/L.
While a number of such diagrams are used in different fields such as hydrogeology and limnology, the diagram developed by Reszo Maucha in 1932 is particularly useful. The original Maucha diagram summarises the major ions in a water sample in a manner that allows for rapid comparison between several water samples by means of an eight-pointed star, where the concentrations (converted to be in milli-equivalents/liter) of cations (K+, Na+, Ca2+, and Mg2+) are on the right, and anions (SO42-, Cl–, CO32-, and HCO3–) are on the left of a background circle, which depicts the shape of a theoretical, perfectly balanced sample with each ion at the same concentration, and the circle is scaled in proportion to the Total Dissolved Salts (TDS).
Original manuscript of Rezso Maucha
Mike Silberbauer has adapted the original Maucha diagram by using the Total Alkalinity (TAL) of the sample to represent CO32- and HCO3–, thereby reducing the analytical costs while remaining chemically accurate. This diagram is used by the DWS on all their water quality monitoring location datasets, which can be accessed on the DWS website.
The Silberbauer adaptation of the Maucha diagram results in an empty, available slot on the original Maucha diagram, and Carin Bosman of CBSS has been using this empty slot to represent nitrate (NO32-) as an additional anion of concern, as this variable can indicate a significant human health concern, as well as act as an indicator of nutrient loads which could affect aquatic organisms in especially surface water bodies. Elevated nitrates could reflect possible contamination resulting from for example improper sanitation. This adaptation is referred to as a Mauchino diagram (Maucha Including NO32-). In reducing environments, such as deep groundwater, the nitrates can be replaced with ammonium (NH₄⁺) to represent the presence of the available Nitrogen.
The Mauchino diagram is a very useful way to symbolise TDS while simultaneously giving an indication of salt ratios and the chemical characteristics of a water resource, and the Mauchino diagrams for various monitoring locations can easily be added to a map or Google Earth®.
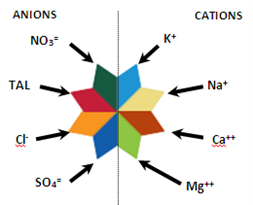
The legend for, and examples of Mauchino diagrams from different types of water, are illustrated below:
Legend for the Mauchino Diagram
Mauchino Diagram for typical Acid Mine Drainage affected water, with prominent sulphates and calcium
Mauchino Diagram for a water sample influenced by nitrates
Mauchino Diagram for an endorheic pan with prominent sodium-chloride characteristics
Try to make your own
Use our Salt Balance Chart-maker
CBSS has created a Salt Balance Chart-makes to represent water quality results in a Mauchino diagram, and you can use it to create your own Mauchino diagram for your own water samples, below, from where you can download and use it (just note that the size of the diagram will not be relational to other samples, and you have to scale it based on the radius given):
Mauchino Diagram (with Title + Auto Filename)
Salt Balance Chart-maker for Mauchino Diagrams
Ion Colour Legend
K⁺
Na⁺
Ca²⁺
Mg²⁺
SO₄²⁻
Cl⁻
TAL (CO₃²⁻ and HCO₃⁻)
NO₃⁻
Interested in making more than one Salt Balance Mauchino diagram at a time, or want include your branding, logo, colours, and other specifications?
Get in Touch
If you need more information on our Mauchino Salt balance Chart-maker, or want to know how to present similar water information graphically, contact us, we have solutions!